2019-01-12

20779 Analyzing Data with Excel - Key Points

Data Analysis in Excel
  • When connecting to SQL Server in the Excel, if you clear the Encrypt connection check box in the data connection wizard, data will be transferred from SQL Server to Excel in plain text. A malicious user might be able to intercept and examine unencrypted data. Unless you are sure that no data in the database is sensitive or confidential, always encrypt the connection.


Importing Data from Files
  • You can choose to load data from the preview window when you import data. The same two options, Load and Load To, are available at the preview. Unless you are certain that the data is in the format you require, use Query Editor to check and modify data as needed.


Importing Data from Excel Reports
  • Using the Advanced Editor in the Query Editor has several advantages. For example, you can perform tasks not supported by the user interface, such as creating filters with more than two clauses, or performing unpivot operations and renaming the result columns at the same time (using the user interface, you must rename the columns as a separate step). You can also change the source if you need to perform the same transformations against a different report.


Creating and Formatting Measures
  • Before you use time intelligence functions in your calculated columns and measures, you must have a date table in your Data Model and have created appropriate relationships between that date table and any date columns in your Data Model.


Visualizing Data in Excel
  • If you are constructing a data model to build visualizations, consider hiding data that is not relevant to the visualizations. Examples include primary and foreign key identity fields (for example, a product ID or a sales order ID). These fields are used to relate data between tables together, but the values that they contain are not meaningful on any report or chart. Similarly, consider creating measures to abstract data and make it easier to consume in a visualization. For example, a sales table will have a record for every sale, but you could also include a measure that calculates the year-to-date sales for given criteria.
  • Excel provides a number of new chart types that you can use for visualizing data. These chart types include Treemap, Sunburst, and Histogram charts. However, while you can use these chart types to present information retrieved from a data cube, you can use them with PivotTables. If you wish to use them with the data held in an Excel Data Model, you must use cube functions to extract the required information. 
  • You should be aware that when you convert from a PivotTable to formulas you lose some functionality. For example, the ability to perform label and value filtering is no longer available. However, any slicers that you defined will continue to operate; the cube formulas are written to reference them.


Using Excel with Power BI 
  • A personal OneDrive service is also cloud-based, but Power BI does not support personal Microsoft accounts. Therefore, when you first connect to an Excel spreadsheet in a personal OneDrive account, you must sign in with your personal account. If you select the Keep me signed in option, Power BI can continue to synchronize automatically with the Excel workbook as it does with OneDrive for Business.
  • You should ensure that any ranges of data in the Excel workbook are converted to named tables or added to the data model before you use the workbook in Power BI. Data in ranges is not fully supported in Power BI.

2019-01-09

20778 Analyzing Data with Power BI - Key Points


Introduction to Self-Service BI Solutions
  • Data analysis should answer questions, and offer guidance in decision-making.
  • To collaborate and work cohesively, analysts must be able to synchronize their teamwork.
  • To be more efficient, and therefore more competitive, organizations of all sizes must gather data to some extent.
  • The data must be architected and presented in a design that the organization can understand.
  • The technical architect must communicate with the BI developers, and the operations team to ensure the BI environment is configured correctly.
  • When more than one data modeller is working on the model, it is important that standards and naming conventions are created and adhered to. Data might be imported from different systems, so naming conventions are likely to vary across sources. This inconsistency should be addressed during the modelling process. If the model comprises a data warehouse, naming conventions should be used for the fact, lookup, and history tables.
  • The semantic information should enable the model to describe itself.
  • In-memory data and real-time operational analytics have the advantage that the data does not need to be extracted to a secondary location because in-memory processing is designed for optimal performance and can better handle aggregations.
  • Having the ability to use the data generated from Software as a Services (SaaS) such as Facebook and Google Analytics is important for gathering a complete picture of activity in your data.
  • If you are connecting to a database such as SQL Server, then using stored procedures to query the data is a preferable option. A stored procedure is a query that is stored on the server. Stored procedures are more efficient than specific, one-off queries because SQL Server creates an execution plan, which it reuses each time the procedure is called. This plan works out the optimal way to retrieve the data, resulting in the fastest possible return of results. They can also be used by other colleagues; sharing code prevents duplication of effort.
  • It is important that you only return rows and columns from the database that you intend to use in your reports. Not only does importing unnecessary data create additional network traffic, but it also makes larger datasets more cumbersome to work with.
  • The data that is extracted from the source system must be transformed into the correct format for loading into the destination database. Metadata must exist before transformations can be applied. The metadata determines what transformations need to be applied to the source data held in the staging tables so it can be loaded into the destination database. To accurately report on the data, you must ensure values are consistent if you intend to use them for filtering.
  • Before applying any transformations to your data, it is a good idea to clean, or cleanse, the data first. This process corrects dirty data or removes it to another area for investigation. You want the quality of your data to be as high as possible.
  • Logging missing values that are compulsory in the destination database.
  • True and False values are frequently stored as 1 and 0 values in the source database and should be converted.
  • Currency and number fields should be formatted and handled carefully. Ensure decimal columns that undergo any rounding up or down do not skew figures and produce unexpected results. If accuracy is critical, then you must ensure that values are entered correctly into the destination database. If decision makers are not concerned about precision and are happy with an approximate figure in aggregations, then you have more freedom to apply some formatting.
  • Modern database features, such as in-memory data, and columnstore indexes, enable faster performance of handling aggregations of large datasets alongside up-to-the-minute results.
  • If you need to display progress in attempting to meet a target figure, 100 percent stacked charts are useful.
  • Line and area charts are useful for displaying data over a period of time, such as financial data.
  • Scatter charts are useful for displaying large sets of data and, in particular, highlighting nonlinear trends, outliers, and clusters. The more data you include, the better the results. Your scatter chart must include a point identifier, otherwise, all the data is aggregated into a single point. You should add a non-numeric data field, such as Categories, to the chart Details property.
  • When presenting your data in a report or dashboard, you should take care to ensure the most important information is easy to find. If your audience normally reads from left to right, top to bottom, then displaying the most critical data in the top left, flowing through to less important content at the bottom right, is helpful. If you have important figures that need to be presented clearly, so that they can be easily read, then the Card and Multirow card charts suit this purpose.
  • In the card chart, if the Value column is not specified as a currency data type, then it shows only a number without the currency symbol. This should be included to make clear that it is a monetary figure. The data label can be turned off, but unless it is entirely clear what the figure refers to, this is best included.
  • The multirow card chart is a useful way to clearly present numbers, without using the format of a table or matrix chart—which are difficult to digest. Like tables, the multirow card chart works best for smaller data sets; otherwise, there is too much data and text to read. For example, a multirow card chart is useful for displaying main categories, and sales.
  • The map chart is useful for presenting data based on cities, rather than wide areas.
  • The filled map chart is particularly useful for presenting socioeconomic or demographic data, because it provides a visual overview of data across a wide area, such as all the states in the United States.
  • The shape map is ideal for comparing values across regions, such as demographic data.
  • Using a table or matrix is useful when you want to display the actual numbers, such as for financial data, and is best used for smaller sets of data.
  • Unlike a table or matrix chart, the tree map is more efficient in how it uses the space it consumes in a report. For example, by showing both City and Category in the tree map, it has effectively flattened the data and prevents the need for drilling down to see categories for each city.
  • Having knowledge of the business, formatting data, and understanding which visualizations best display the data, are useful for making the most of the BI solution.
  • Users must understand the principles and structures of data that is sourced from a relational database, a data warehouse, or an unstructured big data source, such as a social media site.
  • Users should be familiar with all the major chart types and understand how to use them to display data most effectively so that decisions can be made. For example, geographic data is best presented using a map chart; a scatter chart should be used to show overlaps in data, clusters, and outliers. Financial data, such as a share price, is best displayed using a line chart.


Introducing Power BI
  • DirectQuery is useful if you have very large datasets, and want to create your visualizations without loading large volumes of data. However, DirectQuery is not without its limitations, so you should shape data before you create your dataset. Each time the data is queried, the performance is dependent on the data source system, and how fast the data source system responds to the data request.
  • Templates are useful for reusing data that has already been shaped, and visuals that have been customized using corporate colours. If you are producing several reports that share data, visuals, and formatting, templates are a useful feature for avoiding the duplication of work while ensuring consistency across reports.
  • When creating a report or dashboard, the most important information should be presented first, in the top left-hand corner of the screen. This is particularly important when designing for mobile devices; a user will not be able to move pinned items, so it is vital to have the most important visual at the top—so it is visible first on a small mobile phone screen.
  • Try to avoid having so many visuals on a report or dashboard that make the user scroll across or down.
  • The most important information should not only be displayed first but should also have the biggest visual suitable for presenting it. You size visuals so that important information is displayed in bigger visuals and less important information in smaller visuals. This guides the user to interpret and digest the report or dashboard more efficiently.
  • Your charts should be consistent, both in terms of design and axes. Ensure scales on axes and the order of dimensions are consistent and be aware of how you use colours. 
  • When displaying numbers, avoid using too many numerals, as this makes it difficult to read. Rather than displaying a card with $145,000,000, present the data as $145m or $145 million, because this is quicker and easier for the mind to interpret.
  • Charts that present data over time should also be consistent, especially if you apply filterings. for example, don’t have one chart that displays data for the last quarter next to a chart showing data for April last year.
  • Avoid using pie charts when you have many categories. When the number exceeds about seven or eight categories, choose another visual such as a bar or column chart. If there are too many, this makes it difficult to compare in a pie chart.
  • When importing data by connecting to a data source, the Edit button to make transformations is a useful step if you have a large dataset, but want to reduce the amount of data that you import by excluding columns or filtering rows.
  • If you remove tiles from a dashboard, be aware that the underlying datasets are also removed so you cannot use this data for your Q&A. This is particularly important if you pin the visualization answer to your dashboard.


Power BI Data
  • After changing any data types that need altering, it’s good practice to then check that columns that Power BI has set as the default for sort orders, or aggregating, are correctly determined. 
  • When working with visuals, try to present data in an optimum way for enabling the end user to quickly digest the presented information. There are a few things you can do to optimize your data and make it more consistent. This helps you to work with your data more efficiently, focusing on the information you need. It is also helpful to colleagues or anyone with whom you might share the data.
    • It’s a good idea to hide fields that you know you are not going to use in your visuals.
    • Sorting data by correct attribute rather than automatically ordered alphabetically makes data analysis much easier as the user can read the data in the correct order. For instance, sort time data by day/month number instead of day/month name by default. 
    • Changing data types and formatting data are good ways of optimizing your data. This presents the data with clarity in your reports and dashboards.


Shaping and Combining Data
  • You can apply a sort to multiple columns in a query, though you should always start with the column that has the least unique values. For example, apply the sort in order of Country, Region, and the City.
  • You should always remove data that isn’t required. The dataset should be as succinct as possible, so you do not have redundant data that is loaded unnecessarily. If you have a large dataset, remove everything that isn’t required to make it as small as possible to improve the performance of handling the data in Power BI. This means less data is transferred from the source to Power BI; there is less data to be processed as the Query Editor applies the transformations, and you have less extraneous data when creating reports.
  • Your columns should have names that make it easy to work with them when creating reports and viewing dashboards. Each column name should give the data in that column an adequate description. This is particularly relevant when working with datasets containing several tables and columns—it makes it easier to find the right fields to add to report visuals. Power BI Q&A, which uses the natural query language, also returns more accurate results if it can find the data needed to answer the question being asked of it.
  • It is a good idea to check the given column types are as you would expect, and then format any that are incorrect. This can be critically important for decimal columns, where changing the data types between a decimal and a whole number could potentially give false results in calculations. In addition to formatting the data so it presents better in data labels.


Modelling Data
  • When you refer to a column in a DAX formula and include the table name, this is known as a “fully qualified column name”. You can exclude the table name when the measure refers to a column in the same table in which it also resides; however, it is good practice to include it. While this can lengthen formulas that reference many columns, it provides clarity and the reassurance that you are referencing the correct columns—you can also create measures that span multiple tables, and move them as required.


Interactive Data Visualizations
  • In the Power BI Desktop settings, Global, Auto Recovery, you can also toggle the Keep the last Auto Recovery version if I close without saving option. This useful feature is turned off by default but is certainly worth enabling to prevent any accidental loss of work.


Direct Connectivity
  • Before connecting to a database in Azure SQL Database, ensure that you have configured the firewall settings to allow remote connections. Microsoft recommends that you allow access at the database level in Azure, rather than at the server level. 
  • DirectQuery restricts you to using a single database, but it is useful when you want to connect to very large datasets that could take a long time to load into Power BI. This can also be problematic when making changes to report items that cause a refresh of the data—this can cause further delays and make it cumbersome to work with the data. 
  • The Power BI Q&A natural language feature is not available when using DirectQuery. Q&A uses the data that is imported into datasets to build answers and cannot create this without the data being present. 
  • Before you can connect to SQL Server Analysis Services by using a live connection from the Power BI service, you must configure a Power BI gateway on your server.
  • The gateway runs as a Windows® service on the server running SQL Server Analysis Services. However, users need a Power BI Pro subscription to view content through the gateway. If you install the gateway in personal mode, you cannot install another gateway on the same machine.


Power BI Mobile
  • The Microsoft Power BI for iOS app is compatible with the iPhone and iPad, and one of the useful features is called Data Alerts which can be added to tiles that display a single number. You can set thresholds to alert you when the number goes above or below the value you set, or you can set both.
  • To use the Power BI mobile app to view reports and KPIs which are created by using SQL Server 2016 Enterprise Edition Mobile Report Publisher along with SQL Server 2016 Reporting Services web portal, you need to enable Basic Authentication on your reporting server.
  • The cached data in the Power BI mobile app is automatically refreshed with data on the Power BI service (not the data source), whenever your device is connected to a network. However, Reporting Services reports and KPIs do not refresh in the background; instead, they refresh when you open them.

2015-09-22

Access SQL Server Configuration Manger of remote instances via Microsoft Management Console


You can connect to SQL Server Configuration Manager via Microsoft Management Console (MMC) to remotely manage SQL Server instances, which is especially useful when dealing with the instances deployed on Server Core. Before you connect it, you must deploy inbound rules to the Windows Firewall in the domain controller server, and then force member servers to apply the updated GPO. If the client is a script or a MMC snap-in, the sink is often Unsecapp.exe. Without deploying proper Windows Firewall rules, you might receive error message below when remotely connecting SQL Server Services in Computer Management:
There is no item in this view.
The RPC server is unavailable (0x800706BA).

To configure the specific Windows Firewall rule, please refer to the following steps:
1. Right-click Inbound Rules node in the target GPO, and click New Rule.
2. In the Rule Type step, choose Predefined, and choose Windows Management Instrumentation (WMI).
3. In Predefined Rules step, choose Windows Management Instrumentation (ASync-In).

For example, you are trying to remotely managing SQL Server Services of SQL-B via Computer Management in SQL-A; however, you encounter the issue described above, before you change any security settings in SQL-B, there are some basic ways could help you troubleshoot it:
1. Turn off Windows Firewall in SQL-B.
2. Turn off Windows Firewall in SQL-A.
3. Open Resource Monitor in SQL-B, switch to Network tab, open Computer Management in SQL-A and connect to SQL-B to check what processes, connections and ports are being using.
4. Open Resource Monitor in SQL-A, switch to Network tab, open Computer Management in SQL-A and connect to SQL-B to check what processes, connections and ports are being using.

Unable to connect/restart SQL Server service when deploying Log on as a service policy on SQL Server


Managed Service Account (MSA) is a special kind of domain account managed by a domain controller and is assigned to a single member computer and used for running services. The MSA password is managed by the domain controller. MSAs can register a Service Principle Name (SPN) with Active Directory. MSAs use a $ name suffix; for example, CONTOSO\SQL-A-MSA$.

If you use an MSA as the SQL Server service account, you need to grant the service account the Log on as a service right within the Group Policy Object (GPO) in the Group Policy Management. After configured the Log on as a service right, if you execute command (gpupdate /force) to force server to apply the updated GPO, you might receive error message – “The service did not start due to a logon failure” when connecting to SQL Server service, or “The request failed or the services did not respond in a timely fashion” when restarting SQL Server service. Check System event log in Windows Logs, you will find more details:
Logon failure: the user has not been granted the requested logon type at this computer.
This service account does not have the required user right Log on as a service.

The issue happens on the server instances starting SQL Server service with default virtual account. If you check Local Group Policy, you will find that NT SERVICE\ALL SERVICES is already added into Log on as a service. You can change Startup type of those SQL Server services to Automatic (Delayed Start) to minimize the conflict issue caused by Group Policy, or manually run the following steps as an alternative solution:
1. Open Services console.
2. Double-click the specific server instance you are trying to start.
3. In Properties dialog box, switch to Log On tab.
4. Clear value in the Password field, click Apply, click OK when prompting message “Passwords mismatch”, then click OK.
5. Retry starting the service.

Note that you must execute the steps above via Services console as it doesn't work in SQL Server Configuration Manager.

To execute the steps in Windows Server Core environment, the easiest way is to use Microsoft Management Console(MMC) because it can be used to access SQL Server Configuration Manager of remote instances:
1. Log on to the server that can connects to Server Core server.
2. Start an MMC snap-in such as Computer Management under Administrative Tools.
3. In the left pane, right-click the top of the tree and click Connect to another computer.
4. In Another computer field, type the computer name of the server that is in Server Core mode and click OK.

If you encounter error messages when execute above steps, please refer to Access SQL Server Configuration Manger of remote instances via Microsoft Management Console.

2015-09-18

SQL Server - Check orphaned users in databases

An orphaned user is a database user whose corresponding SQL login has been dropped or the database is restored or attached to a different instance of SQL Server. You can detect orphaned users in a database by using the sp_change_users_login stored procedure with the @Action='Report' option.  If Action parameter is specified Report, it lists the users and corresponding security identifiers (SID) in the current database that are not linked to any login.
EXEC sys.sp_change_users_login @Action='Report';
You can use the sp_change_users_login stored procedure to relink a database user with a SQL login. To link the specified user in the current database to an existing login, reference the following sample statement:
EXEC sys.sp_change_users_login
   @Action='Update_One',
   @UserNamePattern='sql_user_b',
   @LoginName='sql_user_b'

2015-09-12

SQL Server - Use Windows Authentication across multiple SQL Servers via linked servers by using Kerberos


If you are interested in allowing users to use Windows Authentication across multiple SQL Servers via linked servers, then Kerberos Constrained Deletgation is a feature in Active Directory Domain Services that can help you achieve the goal. In order to use Kerberos, you must have the Service Principal Names(SPNs) set, and have Kerberos contrained deletegation configured. When the SQL Server service starts, an attemp to register the SPN in Active Directory Domain Services is attempted. By default, only the following accounts have permission to register SPN: Local System, Network Service, and Domain Admin.

In SQL Server 2012, by default Virtual Account is assigned and created when installing SQL Server instance, Virtual Account can access the network in a domain environment. To configure Kerberos, referencing the following steps:
1. Login to domain controller.
2. Go to Administrative Tools -> Acitve Directory Users and Computers.
3. Right-click the source machine object that hosts SQL Server -> Properties -> Delegation tab
4. Click Trust this computer for delegation to specified services only, and leave Use Kerberos only by default.
-> click Add button
-> Users or Computers
-> Advanced
-> Find Now
-> choose the destination machine(s)
-> choose the objects under MSSQLSvc service type, each instance has two objects under this type, please note that the port values respresent the default instance are displayed blank and 1433 for instance name and default port respectively.

If you use Managed Service Account(MSA) to start on SQL Server service, you need to grant sufficient permission to the account so that it can register SPN, and also you must configure Kerberos by accounts in domain controller via the following steps:
1. By default the Delegation tab is hidden in Users object. You must run the following sample of command to make it visiable: setspn -a MSSQLSvc/SQL-A.Contso.com spiner_tsai
2. Go to Administrative Tools -> Acitve Directory Users and Computers.
3. Right-click the account -> Properties -> Delegation tab
4. Same action as step 4 above.

2015-09-11

SQL Server - Precautions against Copy Database Wizard


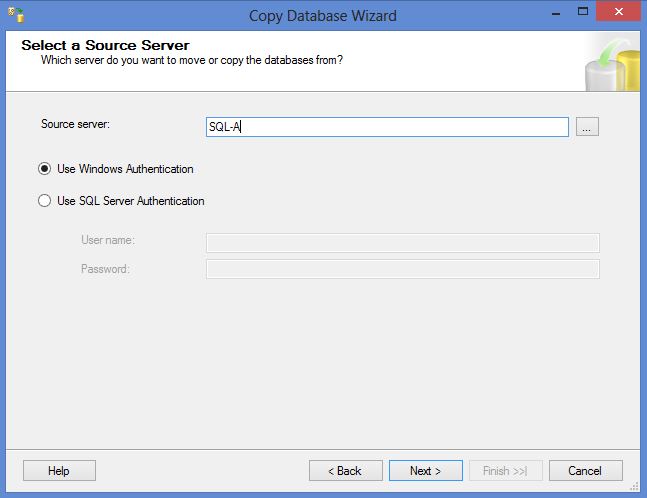
The Copy Database Wizard will create an Integration Services package to copy or move database(s), there are a couple of things you need to be aware of:

1. To use the Copy Database Wizard successfully, SQL Server Agent must be started on the destination instance.

2. You must select an Integration Services Proxy account that has access to the file system on both the source and destination instances.
1) Create an Integration Services Proxy account by first creating a credential under the Security node mapping to a user that has the appropriate permissions on the destination instance.
2) Add an SSIS Package Execution Proxy mapped to the newly created credential:
I. Start SQL Server Agent (if it is disabled).
II. Expand Proxies node, right-click SSIS Package Execution and choose New Proxy.
III. In New Proxy Account dialog, specify name in Proxy name field, and map to the newly created credential in Credential name field.

3. If destination instance does not have features that have been installed on source instance, the package may not be successfully executed. For instance, if Full-Text Filter Daemon Launcher has been installed on source instance while destination instance does not have,  you will receive an error message as follows:Full-Text search is not installed, or a full-text component cannot be loaded.
Note that select Text file in Logging options within Copy Database Wizard is helpful to find more details about the encountered error.

SQL Server - New built-in T-SQL features in SQL Server 2012 (compare with SQL Server 2008)

--Date/Datetime Functions
SELECT DATETIMEFROMPARTS(2012, 2, 12, 18, 10, 5, 997)
SELECT DATETIMEFROMPARTS(2012, 2, 12, 18, 10, 5, 998)
Be careful the millisecond part, 998 returns the same result as 997.
Be careful the millisecond part, 999 returns the result as 000 and add 1 to second part.
Because the milliseconds part of the end point 999 is not a multiplication of the precision unit, so SQL Server ends up rounding the value to next second.
SELECT DATETIMEFROMPARTS(2012, 2, 12, 18, 10, 5, 999)
SELECT DATEFROMPARTS(2012, 2, 12)

--★★★--
--Returns the end of input month date.
SELECT EOMONTH(GETDATE())
--====================================================================================================
--String Functions

Substitutes a NULL input with an empty string.
SELECT CONCAT(NULL, '1', '2')

--★★--
Formats an input value based on a format string.
For more details, refer here: http://msdn.microsoft.com/en-us/library/26etazsy%28v=vs.110%29.aspx
SELECT FORMAT(123456789,'####-##-#.00')

Accepts a list of expressions as input and returns the first that is not NULL, or NULL if all are NULLs Or return something else by designating the last expression.
SELECT COALESCE(Class, Color, ProductNumber) AS FirstNotNull
FROM Production.Product
The result above is same as the following, after testing, its performance is the same as well,
the only advantage is simplify the statement.
SELECT CASE
    WHEN Class IS NOT NULL THEN Class
    WHEN Color IS NOT NULL THEN Color
    WHEN ProductNumber IS NOT NULL THEN ProductNumber
    ELSE NULL
    END
FROM Production.Product
There are a couple of subtle differences between COALESCE and ISNULL. The type of the COALESCE is determined by the returned element, whereas the type of the ISNULL expression is determined by the first input.
DECLARE @x AS VARCHAR(3) = NULL, @y AS VARCHAR(10) = '1234567890'
SELECT COALESCE(@x, @y) AS [COALESCE], ISNULL(@x, @y) AS [ISNULL]

Returns NULL instead of failing convert the input expression to the target type.
SELECT TRY_CONVERT(DATE, 2012)
SELECT TRY_CONVERT(INT, 'TEST')
Note that it still needs to follow the rule of conversions table.
--====================================================================================================
--Order Functions

Specify the OFFSET clause indicating how many rows you want to skip (0 if you don’t want to skip any); you then optionally specify the FETCH clause indicating how many rows you want to filter.
SELECT CREATED
FROM TransmaxDW.dbo.JiraIssues
ORDER BY CREATED DESC
OFFSET 50 ROWS FETCH NEXT 25 ROWS ONLY
--====================================================================================================
--Aggregate Functions

--★★★--
--Calculate accumulating value
In the window frame clause, you indicate the window frame units (ROWS or RANGE) and the window frame extent (the delimiters). With the ROWS window frame unit, you can indicate the delimiters as one of three options:
1. UNBOUNDED PRECEDING or FOLLOWING, meaning the beginning or end of the partition, respectively.
2. CURRENT ROW, obviously representing the current row.
3. <n> ROWS PRECEDING or FOLLOWING, meaning n rows before or after the current, respectively.
SELECT custid, orderid, orderdate, val,
  SUM(val) OVER ( 
          PARTITION BY custid
          ORDER BY orderdate, orderid
          ROWS BETWEEN UNBOUNDED PRECEDING AND CURRENT ROW
          --ROWS UNBOUNDED PRECEDING --Shorter form, same result as above
         ) AS runningtotal
FROM TSQL2012.Sales.OrderValues;
If you define a order clause without a frame clause, the default is as follows, unless you are after the special behavior you get from RANGE that includes peers (tied rows), make sure you explicitly use the ROWS option. In SQL Server 2012, the ROWS option usually gets optimized much better than RANGE when using the same delimiters.
RANGE UNBOUNDED PRECEDING
--====================================================================================================
--Offset Functions

--★★★--
--Retrieve data from a previous row or next row
SELECT custid, orderid, orderdate, val,
    LAG(val) OVER
    (
     PARTITION BY custid
     ORDER BY orderdate, orderid
    ) AS prev_val,
    LEAD(val) OVER
    (
     PARTITION BY custid
     ORDER BY orderdate, orderid
    ) AS next_val
FROM TSQL2012.Sales.OrderValues;
The second argument represents offset position, the number of rows back/forward from the current row from which to obtain a value. If not specified, the default is 1. It can be a column, subquery, or other expression that evaluates to a positive integer or can be implicitly converted to bigint. The third argument represents the value to return when scalar_expression (first argument) at offset is NULL. If a default value is not specified, NULL is returned. It can be a column, subquery, or other expression, but it cannot be an analytic function, it must be type-compatible with scalar_expression.
SELECT custid, orderid, orderdate, val,
    LAG(val, 2, 0) OVER
    (
     PARTITION BY custid
     ORDER BY orderdate, orderid
    ) AS prev_val,
    LEAD(val, 2, 0) OVER
    (
     PARTITION BY custid
     ORDER BY orderdate, orderid
    ) AS next_val
FROM TSQL2012.Sales.OrderValues;

--★--
Return a value expression from the first or last rows in the window frame.
SELECT custid, orderid, orderdate, val,
    FIRST_VALUE(val) OVER
    (
     PARTITION BY custid
     ORDER BY orderdate, orderid
     ROWS BETWEEN UNBOUNDED PRECEDING AND CURRENT ROW
    ) AS first_val,
   LAST_VALUE(val) OVER
   (
    PARTITION BY custid
    ORDER BY orderdate, orderid
    ROWS BETWEEN CURRENT ROW AND UNBOUNDED FOLLOWING
   ) AS last_val
FROM TSQL2012.Sales.OrderValues;
When a window frame is applicable to a function but you do not specify an explicit window frame
clause, the default is RANGE BETWEEN UNBOUNDED PRECEDING AND CURRENT ROW. Also, if you’re after the first row in the partition, using the FIRST_VALUE function with the default frame at least gives you the correct result. However, if you’re after the last row in the partition, using the LAST_VALUE function with the default frame won’t give you what you want because the last row in the default frame is the current row. So with the LAST_VALUE, you need to be explicit about the window frame in order to get what you are after. And if you need an element from the last row in the partition, the second delimiter in the frame should be UNBOUNDED FOLLOWING.
--====================================================================================================
--Full-Text Data

You can create a search property list to define searchable properties for your documents. You can include properties that a specific filter can extract from a document. See the Books OnLine for SQL
Server 2012 article "Find Property Set GUIDs Property Integer IDs for Search Properties" for the list of some well-known ones, or refer to this article "Search Document Properties with Search Property Lists" see how Full-Text Search works with search properties.
CREATE SEARCH PROPERTY LIST WordSearchPropertyList
GO
ALTER SEARCH PROPERTY LIST WordSearchPropertyList
ADD 'Authors'
WITH (
   PROPERTY_SET_GUID = 'F29F85E0-4FF9-1068-AB91-08002B27B3D9',
   PROPERTY_INT_ID = 4,
   PROPERTY_DESCRIPTION = 'System.Authors - authors of a given item.'
);
--====================================================================================================
--Sequence Object

A sequence is a user-defined schema-bound object that generates a sequence of numeric values according to the specification with which the sequence was created. The sequence of numeric values is generated in an ascending or descending order at a defined interval and may cycle (repeat) as requested. Sequences, unlike identity columns, are not associated with tables.
CREATE SEQUENCE Sales.SeqOrderIDs AS INT
MINVALUE 1
CYCLE;
It is similar to IDENTITY, all numeric types with a scale of 0 are supported. If you don’t indicate a type explicitly, SQL Server will assume BIGINT by default. If you need a different type, you need to ask for it explicitly by adding AS <type> after the sequence name. There are a number of properties that you can set, all with default options in case you don’t provide your own. The following are some of the properties and their default values:
1. INCREMENT BY   Increment value. The default is 1.
2. MINVALUE  The minimum value to support. The default is the minimum value in the type. For  example, for an INT type, it will be -2147483648.
3. MAXVALUE   The maximum value to support. The default is the maximum value in the type.
4. CYCLE | NO CYCLE   Defines whether to allow the sequence to cycle or not. The default is NO  CYCLE.
5. START WITH   The sequence start value. The default is MINVALUE for an ascending sequence  (positive increment) and MAXVALUE for a descending one. */
SELECT NEXT VALUE FOR Sales.SeqOrderIDs;

ALTER SEQUENCE TSQL2012.Sales.SeqOrderIDs
RESTART WITH 1;

INSERT INTO TSQL2012.Sales.MyOrders(orderid, custid, empid, orderdate)
VALUES (NEXT VALUE FOR Sales.SeqOrderIDs, 1, 2, '20120620'),
(NEXT VALUE FOR Sales.SeqOrderIDs, 1, 3, '20120620');

INSERT INTO TSQL2012.Sales.MyOrders(orderid, custid, empid, orderdate)
SELECT NEXT VALUE FOR Sales.SeqOrderIDs OVER(ORDER BY orderid), custid, empid, orderdate
FROM TSQL2012.Sales.Orders
WHERE custid = 1;

ALTER TABLE Sales.MyOrders
ADD CONSTRAINT DFT_MyOrders_orderid
DEFAULT(NEXT VALUE FOR Sales.SeqOrderIDs) FOR orderid;

INSERT INTO TSQL2012.Sales.MyOrders( custid, empid, orderdate)
VALUES (1, 2, '20120620')
If you accidentally reset start value, and the target table also has unique constraint on sequencing column to cause failure of violating constraint. Execute the following command to restart the sequence.
DECLARE @orderid_max INT, @str_alter VARCHAR(500)

SELECT @orderid_max = MAX(orderid) FROM TSQL2012.Sales.MyOrders

SET @str_alter = ' ALTER SEQUENCE TSQL2012.Sales.SeqOrderIDs
        RESTART WITH ' + CONVERT(VARCHAR(5), @orderid_max + 1)
EXEC(@str_alter)
--====================================================================================================
--Error Handling
DECLARE @message AS NVARCHAR(1000) = 'Error in % stored procedure';

SELECT @message = FORMATMESSAGE (@message, N'usp_InsertCategories');
RAISERROR (@message, 16, 0);

SELECT @message = FORMATMESSAGE (@message, N'usp_InsertCategories');
THROW 50000, @message, 0;
The THROW command behaves mostly like RAISERROR, with some important exceptions. Errors must have an error number of at least 50000. The statement before the THROW statement must be terminated by a semicolon (;). This reinforces the best practice to terminate all T-SQL statements with a semicolon. RAISERROR does not normally terminate a batch; however, THROW does terminate the batch.

SQL Server - New management features in SQL Server 2012 (compare with SQL Server 2008)

--★★★--
--FileTables
FileTables are a special type of table that enables you to store files and documents within SQL Server 2012. These files and documents can be accessed from Windows applications as though they were stored normally in the file system. For example, you can add files and folders to the FileTable by dragging and dropping them in Windows Explorer. You can remove them from the FileTable by using the same method.

--★--
--Contained Database
Contained databases include all the settings and metadata required to define the database. Contained databases have no configuration dependencies on the Database Engine instance on which  the database is deployed, so users connect to a contained database without authenticating at the Database Engine level. An advantage of contained databases is that you can easily move them to other instances or to SQL Server 2012 Azure. Having all database configuration settings within the database enables the database owners to manage all those settings for the database.

--★--
--Server Roles
In SQL Server 2012, you can modify the permissions assigned to a new type of server role known as a user-defined server role. User-defined server roles are a new SQL Server 2012 feature. You can  use user-defined server roles to create custom server roles when using one of the existing server roles does not suit your specific requirements.

SQL Server - TCP/IP Properties in SQL Server


Instead of specifying 1433 in the TCP Port text box of each IP type section, you can only specify it in IPAll section.
You cannot specify 1433 in the TCP Port text box in the named instance when it is being used as default TCP port in the default instance. You must specify another fixed port which is not currently being used by other applications, you can run this command to check current port usage: 
netstat -a -n -o
For any instances which is not configured with 1433 default port, you must specify it in the connection string when remotely connecting to the named instance, for example, "SQL-B\ALTERNATE,3341".

The Window Management Instrumentation (WMI) is not available in Windows Server Core environment. The WMI provider is a published layer that is used with the SQL Server Configuration Manager snap-in for Microsoft Management Console (MMC) and the Microsoft SQL Server Configuration Manager. In that case there are two methods to configure TCP/IP properties of SQL Server in Windows Server Core environment.

Method 1
1. Open File Explorer, right-click Computer, and then choose Manage.
2. In Computer Management, right-click Computer Management (Local), and then choose Connect to another computer.
3. In Another computer field, type the computer name of the server that runs Windows Server Core.
4. After connection is successfully authenticated (if you have sufficient permission) you should be able to see SQL Server Configuration Manager snap-in under Services and Applications node.

If you encounter error messages when using Method 1, please refer to Access SQL Server Configuration Manger of remote instances via Microsoft Management Console.

Method 2
You can use SQL PowerShell to configure port by referencing the following steps:
1. Launch the SQL PowerShell in a command prompt.
SQLPS

2. Initialize the namespace that contains the classes representing the core SQL Server database engine objects.
$smo = 'Microsoft.SqlServer.Management.Smo.'

3. Set the ManagedComputer object that represents a Windows Management Instrumentaion(WMI) installation on an intance of SQL Server.
$wmi = new-object ($smo + 'Wmi.ManagedComputer') 

4.
$uri = "ManagedComputer[@Name='SQL-CORE']/ServerInstance[@Name='ALTERNATE']/ServerProtocol[@Name='TCP']"

5.
$Tcp = $wmi.GetSmoObject($uri)

6. Check the value of the IsEnabled propoerty.
$Tcp

7. Set the property to true if it is on false.
$Tcp.IsEnabled = $true

8. Check the properties of each IP type, input different types in @Name parameter, for example, @Name='IP1', @Name='IP2', ..., @Name='IPAll'.
$wmi.GetSmoObject($uri + "/IPAddress[@Name='']").IPAddressProperties

9. Except IPAll, remove any value under TcpDynamicPorts section of each IP type, replace the question mark with specific number.
$wmi.GetSmoObject($uri + "/IPAddress[@Name='IP?']").IPAddressProperties[3].Value=""

10. Remove value of TcpDynamicPorts section in IPAll type.
$wmi.GetSmoObject($uri + "/IPAddress[@Name='IPALL']").IPAddressProperties[0].Value=""

11. Specify fixed port of TcpPort in IPAll.
$wmi.GetSmoObject($uri + "/IPAddress[@Name='IPALL']").IPAddressProperties[1].Value=""

12. Validate all the changes.
$Tcp.Alter()

13. Return all Windows services on local machine that contains key word 'SQL'.
Get-Service *SQL*

14. Stop SQL Server Database engine service of the named instance.
Stop-Service -Name 'MSSQL$ALTERNATE' -Force

15. Start SQL Server Database engine service of the named instance.
Start-Service -Name 'MSSQL$ALTERNATE'